The biggest new feature for Storyteller 4.0 is the ability to execute specifications in an interactive "stepthrough" mode to more easily troubleshoot and debug specifications that are failing. The stepthrough mode supports the familiar debugger concepts of breakpoints, run next, run to breakpoint, or run to the end.
Kicking off the Stepthrough Mode
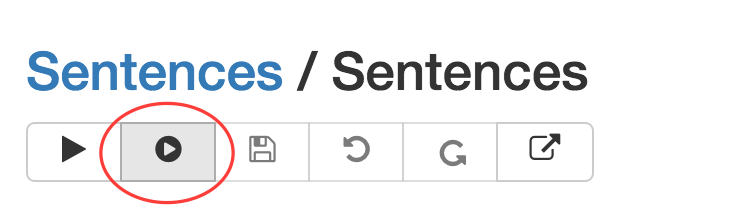
To start the stepthrough execution of a specification, there's a new button in the top left of the specification editor that starts running a specification in stepthrough mode:
Starting the stepthrough mode
You can also trigger the stepthrough mode from a specification editor page with keyboard shortcuts:
ctrl + shift + sorctrl + 3to queue up the stepthrough of the current specificationctrl + 4to recycle the system and queue up the current specification for stepthrough
Understanding the Progress
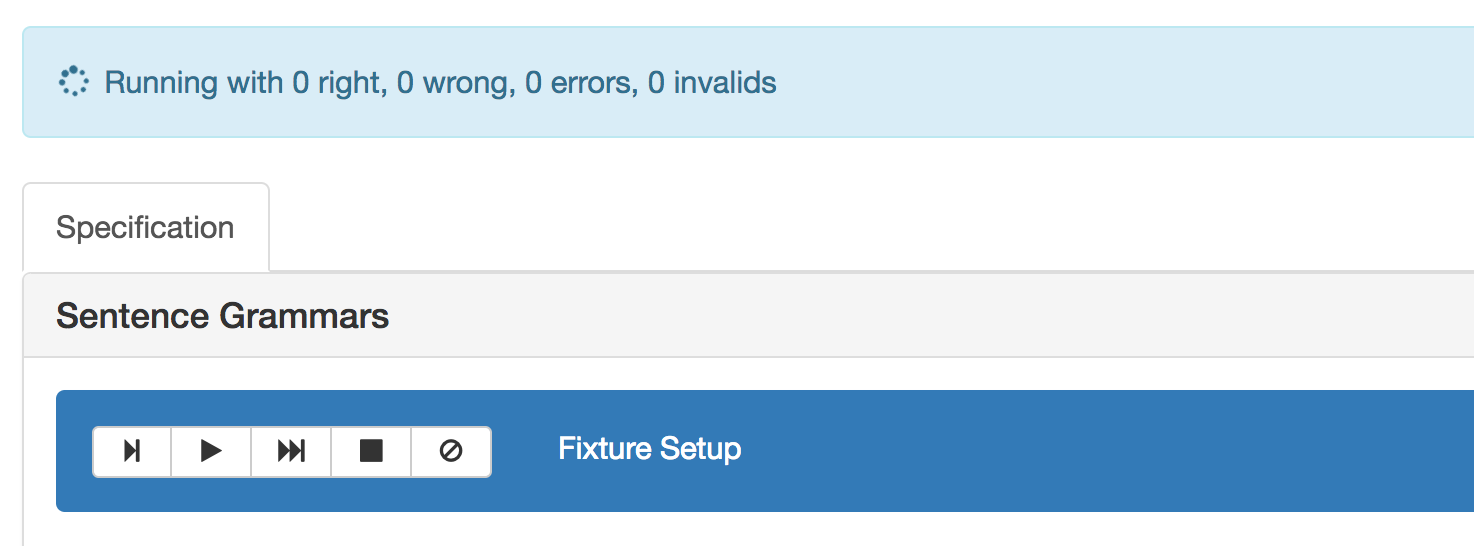
First off, Storyteller will show a progress bar across the top of the page for the current specification:
The status bar during stepthrough

If you navigate away from the specification editor page, you can use the progress bar to navigate right back to the specification that's running in stepthrough mode. You can also cancel the running execution from the same status bar.
Storyteller will highlight the current step (i.e., what is about to be executed) in navy blue like this:
content/images/stepthrough/initial-section-setup.png
One way or another, the Storyteller UI is placing a small control bar right into the highlighted step rendering just to make them easier to find on the page.
Do note that the stepthrough mode shows normally "hidden" steps like Fixture.Setup() or Fixture.Teardown()
to give you a chance to step into those operations during the stepthrough process.
Breakpoints
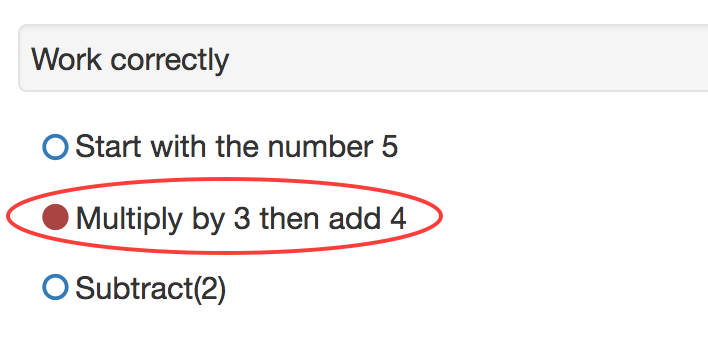
You can toggle breakpoints within the specification by clicking inside of any open circle at the left of a line in the specification. Active breakpoints show as a solid red circle like this:
content/images/stepthrough/setting-breakpoint.png
You can clear all the existing breakpoints with this button in the stepthrough control bar:
Clear all breakpoints
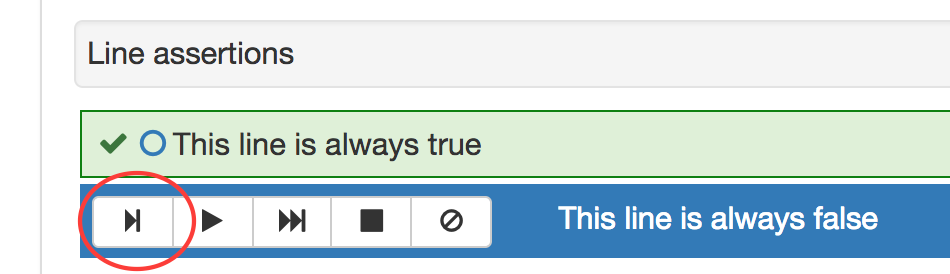
Run the Next Step
To execute only the next specification step, click the button shown below or use the F10 key:
content/images/stepthrough/run-next.png
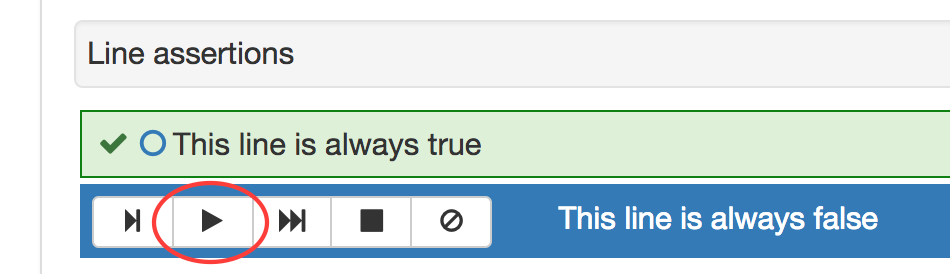
Run to a Breakpoint
To run all the steps up to the next breakpoint, use the button shown below or use the F8 key:
content/images/stepthrough/run-to-breakpoint.png
If there are no breakpoints left before the end of the specification, this will just run the rest of the specification.
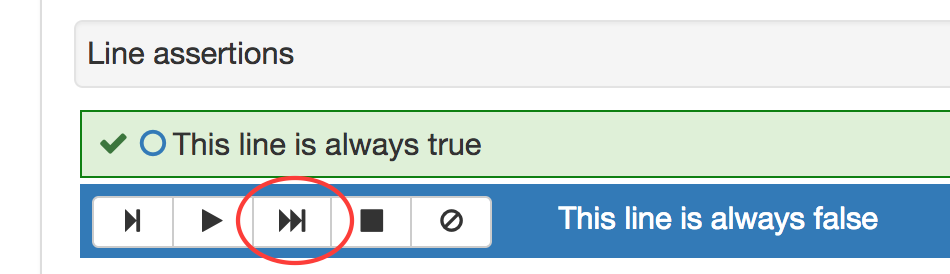
Run to the End
To just say "go ahead and finish running this specification," click the button below or use the shift + F10
keyboard shortcut:
content/images/stepthrough/run-to-end.png
The Storyteller UI will navigate to the results page for the current specification when the stepthrough is complete.
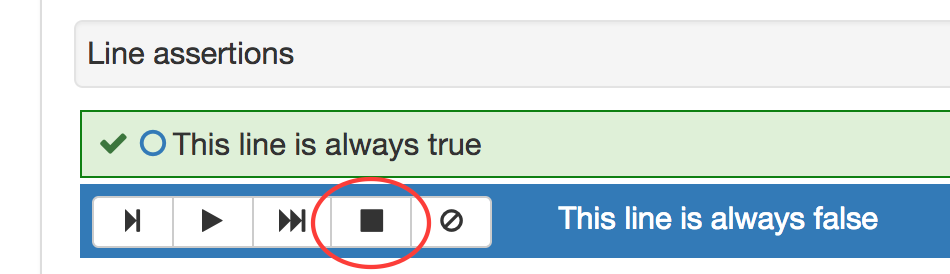
Stop the Stepthrough Execution
To stop the stepthrough execution, click this button or use the link in the progress bar at the top of the page:
content/images/stepthrough/stop-execution.png